
light-dark-switchbtn

Trading Academy

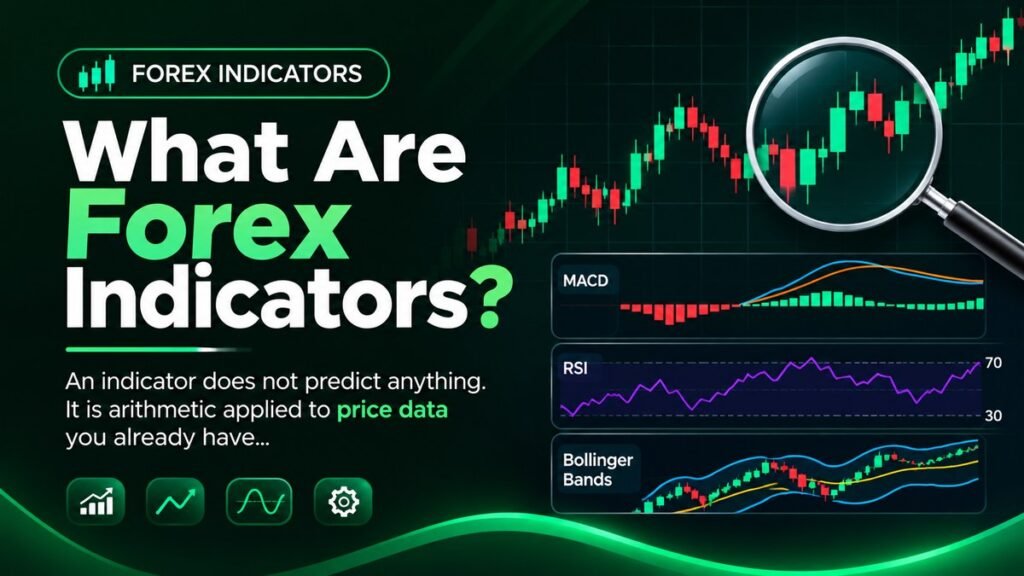
What Are Forex Indicators? A Realistic Introduction

An indicator does not predict anything. It is arithmetic applied to price data you already have, displayed in a form that is easier to read than the raw numbers. Every beginner who understands that sentence early saves themselves years of searching for the indicator that finally works. This is the first lesson [...]

What Are Forex Indicators? A Realistic Introduction

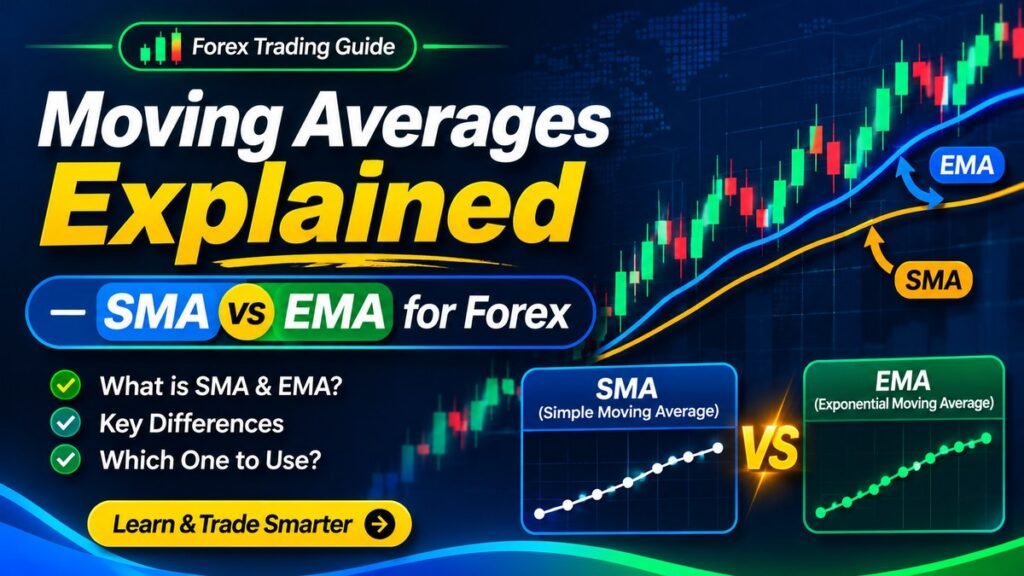
Moving Averages Explained — SMA vs EMA for Forex

The moving average is the oldest and most widely used indicator in trading, and the one most traders misunderstand in the same specific way: they treat it as a signal generator when it is really a filter. Used as a filter, it removes a large share of bad trades. Used as a [...]

Moving Averages Explained — SMA vs EMA for Forex

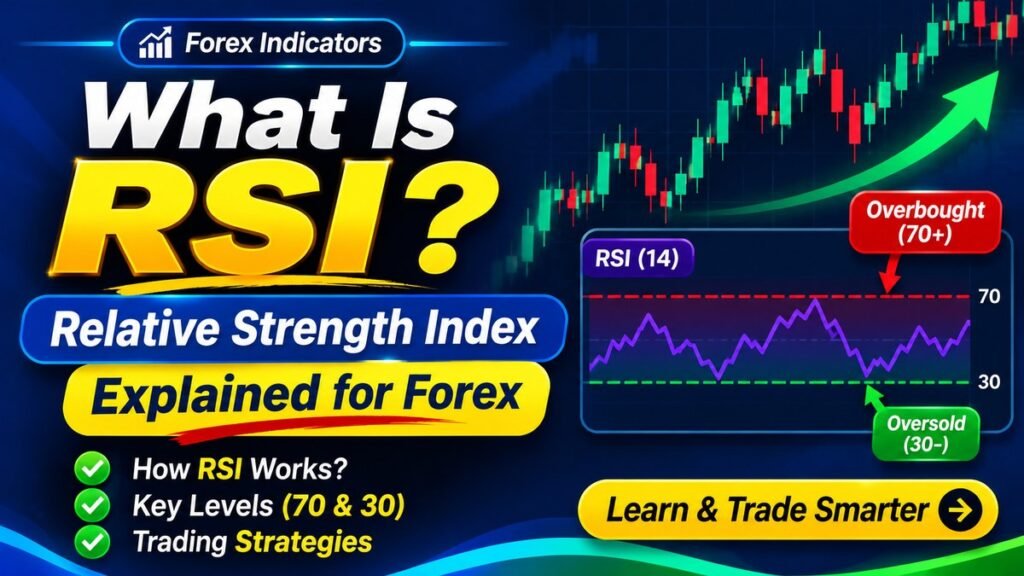
What Is RSI? Relative Strength Index Explained for Forex

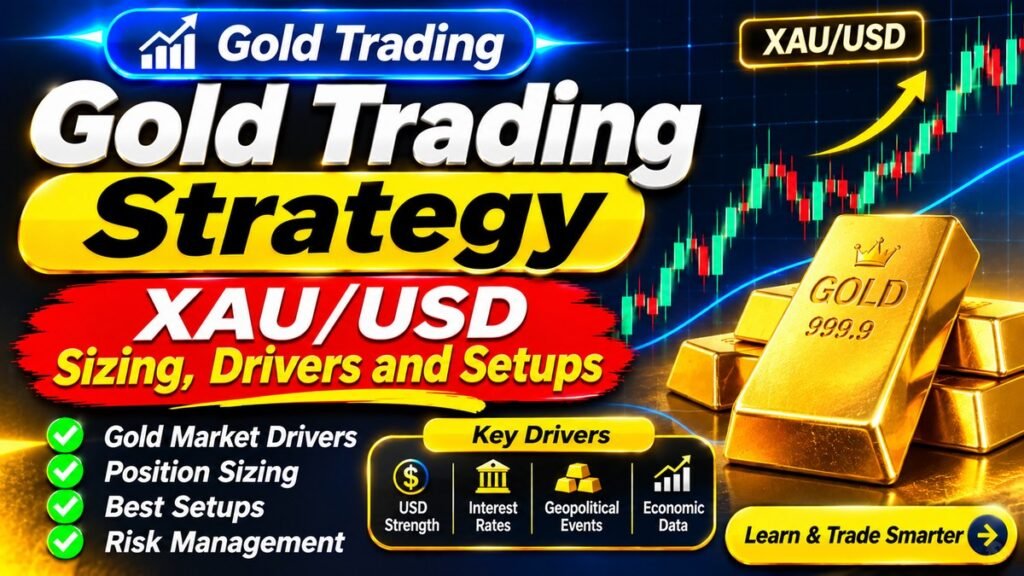
RSI is the most popular momentum indicator in trading and the most consistently misused. The confusion comes down to one word: overbought. It does not mean sell. Traders who learn what it actually means avoid a category of loss that catches nearly everyone at least once. This lesson covers what RSI measures, [...]
What Is RSI? Relative Strength Index Explained for Forex

What Is MACD? Moving Average Convergence Divergence Explained

MACD is built entirely from moving averages, which means it inherits their strengths and their lag. What it adds is a way to see whether momentum is accelerating or fading — a question a single moving average cannot answer. Understanding that distinction is what makes MACD useful rather than just another line [...]

What Is MACD? Moving Average Convergence Divergence Explained

Bollinger Bands Explained — Squeeze, Walk and Real Usage

Bollinger Bands are usually taught as a mean-reversion tool: price touches the upper band, sell. That interpretation is wrong often enough to cost money. What the bands actually measure is volatility — and the most valuable signal they produce has nothing to do with price touching either edge. What Bollinger Bands measure [...]

Bollinger Bands Explained — Squeeze, Walk and Real Usage

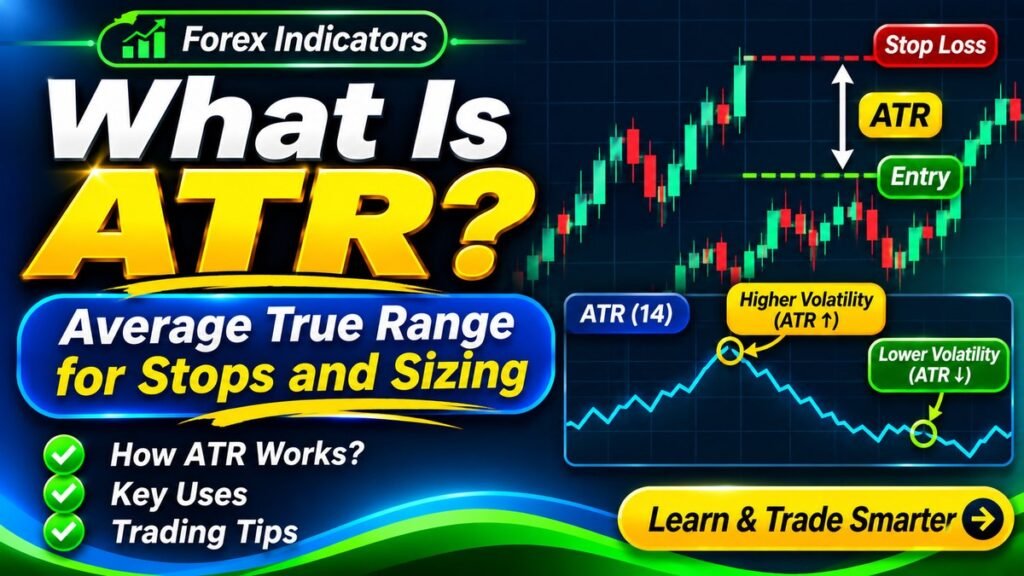
What Is ATR? Average True Range for Stops and Sizing

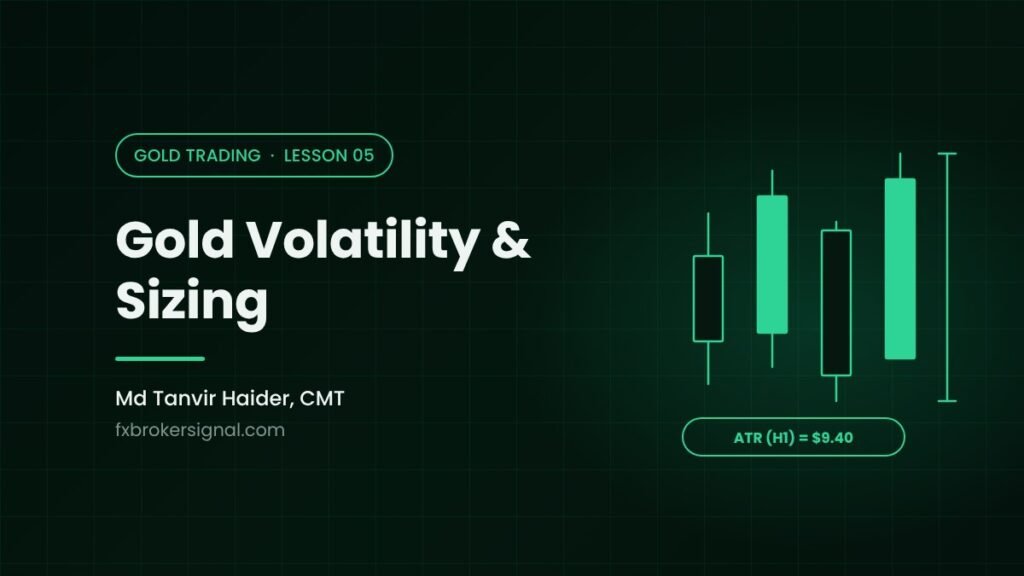
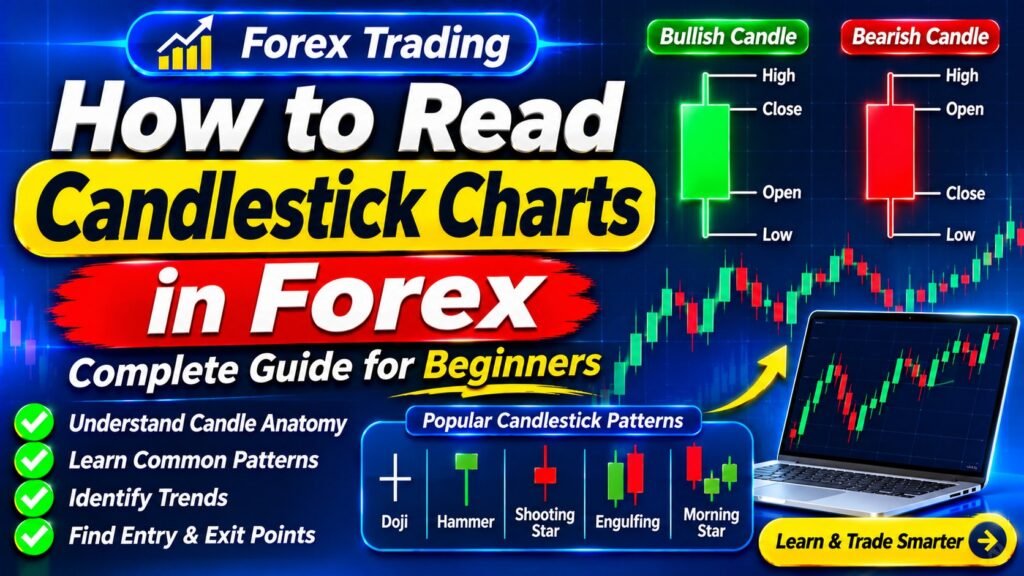
ATR generates no buy or sell signals, which is why most beginners skip it. It is also, in my view, the most practically valuable indicator a new trader can learn — because it answers the question that actually determines survival: how far should my stop be, and how large should this position [...]
What Is ATR? Average True Range for Stops and Sizing

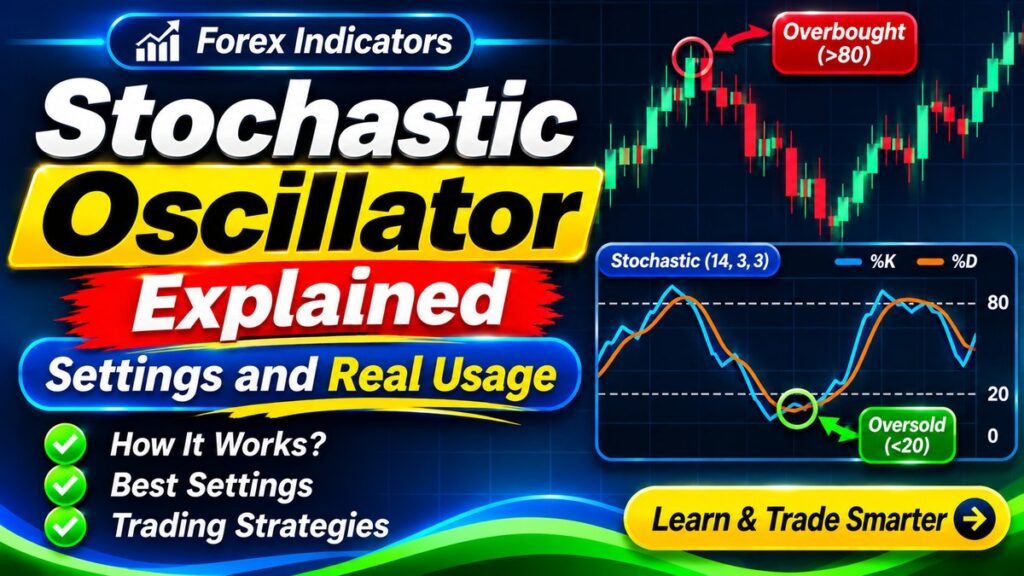
Stochastic Oscillator Explained — Settings and Real Usage

Stochastic asks a narrow question: where did price close relative to its range over the last several candles? Near the top, or near the bottom? That single question turns out to be useful in ranging markets and misleading in trending ones — which is the entire story of this indicator. What Stochastic [...]
Stochastic Oscillator Explained — Settings and Real Usage

What Is ADX? Measuring Trend Strength in Forex

Every lesson in this section has ended with the same caveat: this indicator works in trends but fails in ranges, or the reverse. ADX is the tool that tells you which one you are in. It answers the question the others depend on, which makes it more foundational than its low profile [...]

What Is ADX? Measuring Trend Strength in Forex

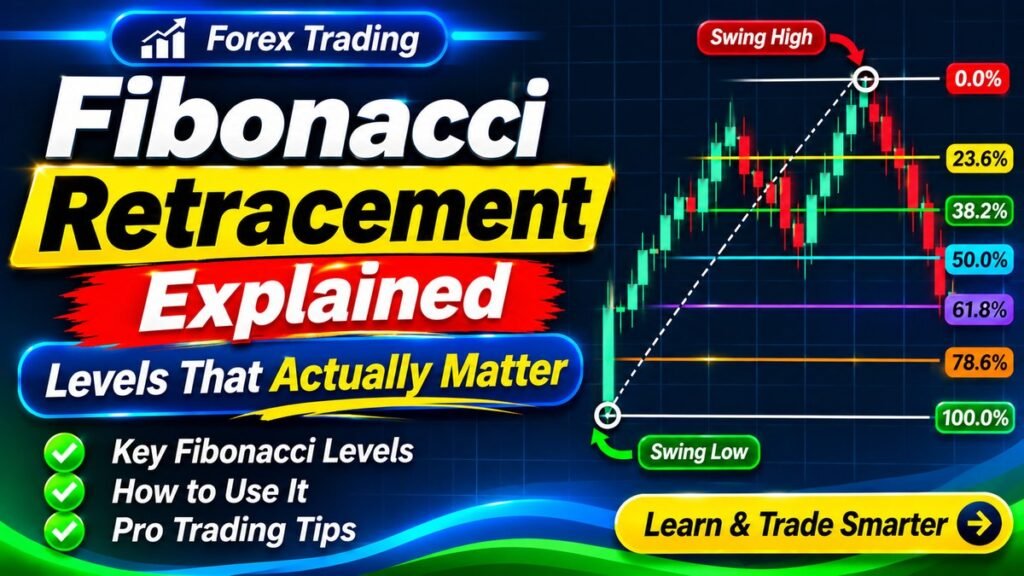
Fibonacci Retracement Explained — Levels That Actually Matter

Fibonacci retracement works, but not for the reason it is usually sold. There is nothing mystical about 61.8% appearing in nature. What makes these levels relevant is that enough traders watch them that orders cluster there — and that is a perfectly good reason, once you stop expecting magic. What Fibonacci retracement [...]
Fibonacci Retracement Explained — Levels That Actually Matter

Pivot Points Explained — Objective Levels for Intraday Trading

Pivot points have one significant advantage over every level-drawing method: there is nothing to draw. The levels are calculated from the previous session’s price, which means every trader using them sees identical lines. No judgement, no disagreement, no drawing from the wrong swing. What pivot points are Pivot points are horizontal support [...]

Pivot Points Explained — Objective Levels for Intraday Trading

How to Combine Forex Indicators Without Overloading Your Chart

Two indicators saying the same thing is not confirmation. It is the same information counted twice, presented in a way that feels like agreement. Understanding which tools are genuinely independent — and which merely look different — is what separates a coherent system from a cluttered chart. The multicollinearity problem The technical [...]
How to Combine Forex Indicators Without Overloading Your Chart

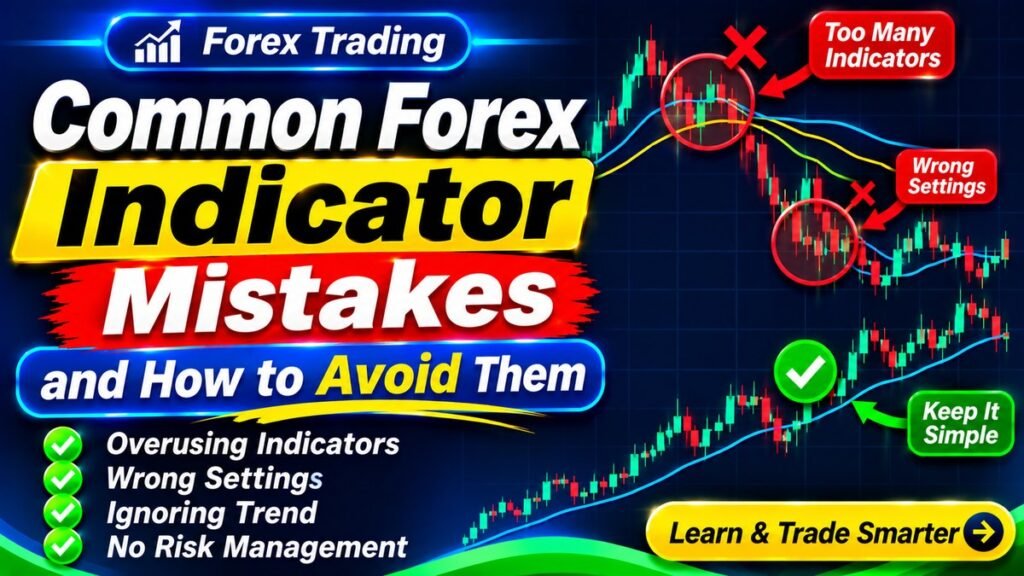
Common Forex Indicator Mistakes and How to Avoid Them

Most indicator problems are not indicator problems. They are expectation problems, applied to tools that were never designed to meet those expectations. This final lesson collects the errors that appear most often, several of which have come up throughout this section — deliberately, because they are that common. Mistake 1 — Expecting [...]
Common Forex Indicator Mistakes and How to Avoid Them

Trading academy