
Trendlines and Channels — Drawing Them Honestly
October 31, 2026

Trendlines have a specific problem no other technical tool shares: two competent traders drawing on the same chart will produce different lines. That subjectivity is worth confronting directly, because it determines how much weight a trendline deserves — which is less than most guides suggest.
What a trendline is
A diagonal line connecting a series of swing points, representing dynamic support or resistance.
In an uptrend, the line connects rising swing lows and sits beneath price. In a downtrend, it connects falling swing highs and sits above.
The underlying idea is the same as horizontal levels: participants act at the line, producing orders that halt or reverse price. The difference is that the level moves over time.
The subjectivity problem
Horizontal support at 1.0850 is 1.0850 for everyone. A trendline depends on which swing points you connect, whether you use wicks or bodies, and how far back you start.
Change any of those and the line sits somewhere else.
Same uptrend, three valid approaches:
Connect wick lows → steeper line
Connect candle bodies → shallower line
Start from a different
swing low → different angle entirely
None is objectively correct. This means a trendline “holding” or “breaking” is partly a function of how you drew it, which is a genuine weakness.
Where this becomes dangerous
The flexibility invites redrawing. Price breaks your line, so you connect different points and produce a line that has not broken. This feels like refining the analysis and is actually rationalising a losing position. If you have redrawn a trendline after entering a trade, the trendline was not the reason for the trade.
Rules that reduce the problem
Trendlines remain useful if you constrain how you draw them.
Three touches minimum. Two points define a line mathematically — any two points do. The third touch is what suggests participants are actually reacting there. A two-touch trendline is a line you drew, not a level the market recognises.
Pick wicks or bodies and never switch. Wicks capture extremes; bodies capture where price settled. Both are defensible. Alternating between them means you can always find a line that fits.
Do not redraw after entering. If the line breaks, the setup is invalid. Write this down as a rule, because it will not feel obvious in the moment.
Prefer shallower lines. A very steep trendline reflects an unsustainable rate of advance and will break quickly regardless of whether the trend continues. Steep lines produce false break signals.
What a trendline break actually means
Less than most traders assume.
A broken trendline means the rate of advance has slowed. It does not mean the trend has ended.
Price can break a steep trendline and continue upward at a gentler angle, forming a new, shallower trendline. The first line broke; the uptrend did not.
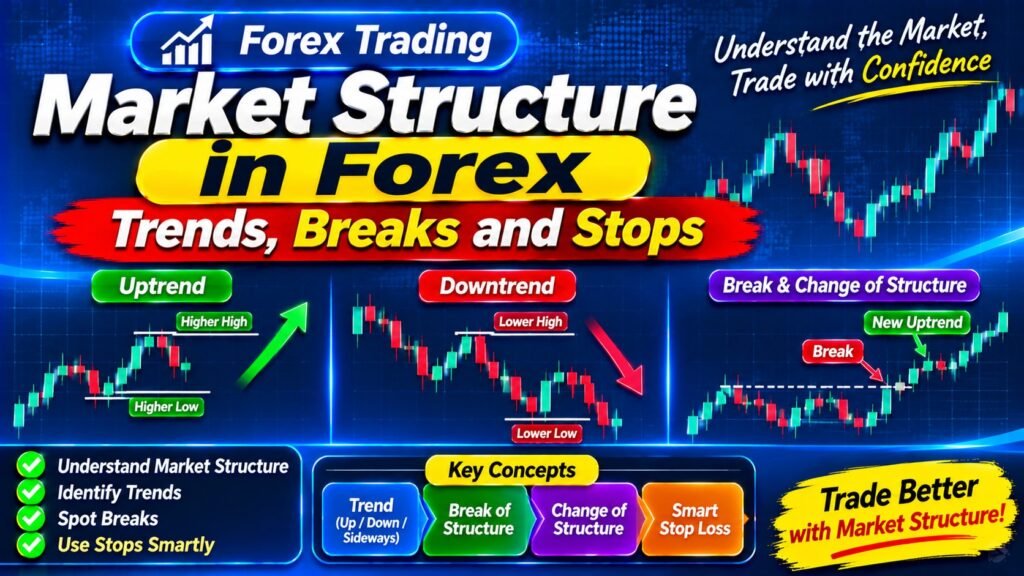
This is why trendline breaks should be read alongside structure. A trendline break plus a break of structure is a meaningful signal. A trendline break alone is a change in pace.
Traders who exit trends on trendline breaks alone frequently exit healthy trends that simply decelerated.
Channels
A channel adds a parallel line on the opposite side of price, creating a corridor.
In an ascending channel, the lower line connects swing lows and the upper line runs parallel above, touching swing highs. Price oscillates between them while advancing.
Channels are useful for two things:
Context. Price near the lower line in an ascending channel is relatively low within the trend — a better location for a long entry than price near the upper line.
Targets. The opposite line provides a natural target for a position entered at one side.
The same subjectivity applies, compounded — you are now drawing two lines rather than one. Channels that require adjustment to keep price inside are not describing anything real.
Trading with trendlines
Used as one input among several rather than as a primary signal.
ENTRY AT A TRENDLINE
Structure: Uptrend confirmed — higher
highs and higher lows
Trendline: Three+ touches, not steep
Wait: Price pulls back to the line
Confluence: Horizontal level or moving
average in the same area
Trigger: Rejection candle at the zone
Stop: Below the last swing low
(structure, not the line)
Note the stop placement. Structure provides a firmer invalidation point than a line whose position depends on drawing choices. The trendline identified the location; structure defines where the idea is wrong.
Where trendlines fail
In ranges. Diagonal lines drawn through sideways price connect points that have no relationship. The lines look valid and mean nothing.
On low timeframes. Swing points form constantly, so trendlines can be drawn almost anywhere. The subjectivity problem is at its worst here.
When too steep. Unsustainable angles break early and often, producing false signals about trend health.
After news. A repricing moves price through lines without regard to them.
An honest assessment
Trendlines are a secondary tool. They are useful for visualising the rate and shape of a trend, and for identifying areas where a pullback might find support.
They are weaker than horizontal levels, which are objective, and weaker than structure, which gives a definitive invalidation point. A trader who dropped trendlines entirely and relied on horizontal levels plus structure would lose very little.
That is not a reason to avoid them. It is a reason not to build a method around them, and to treat a trendline break as information rather than a signal.
What to do next
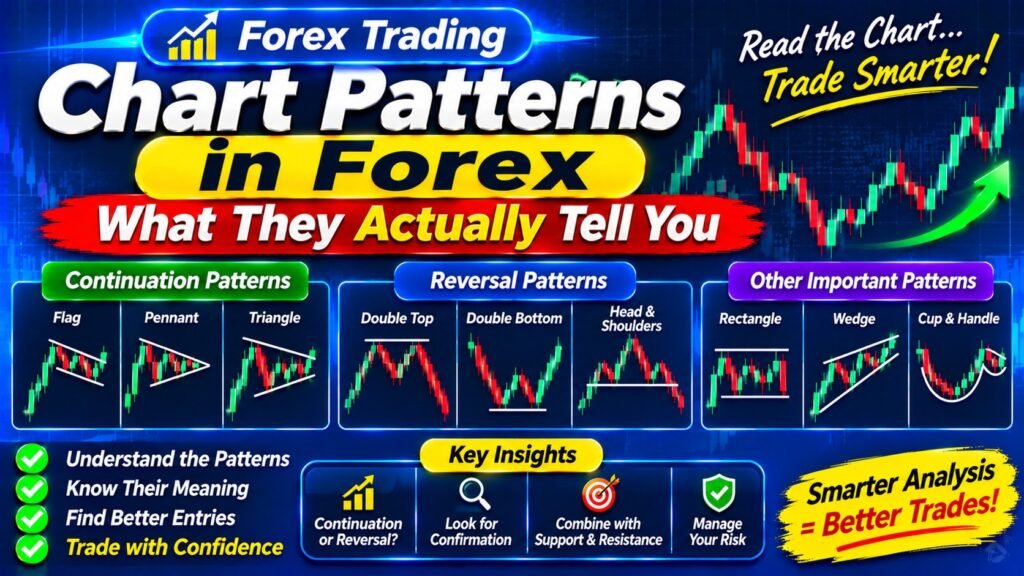
The next lesson covers chart patterns — the larger formations built from structure and levels, and an honest look at how reliable they actually are.
Frequently asked questions
How do I draw a trendline correctly?
Connect at least three swing points — two define a line mathematically, the third suggests participants are actually reacting there. Choose wicks or bodies and stay consistent, and avoid very steep lines, which break early regardless of trend health.
Should I use wicks or candle bodies for trendlines?
Either is defensible — wicks capture extremes, bodies capture where price settled. What matters is consistency. Switching between them means you can always find a line that fits what you want to see.
What does a trendline break mean?
That the rate of advance has slowed, not that the trend has ended. Price often breaks a steep trendline and continues at a gentler angle. A trendline break combined with a break of structure is meaningful; a trendline break alone is a change in pace.
Why do trendlines seem unreliable?
Because they are subjective. Two traders on the same chart produce different lines depending on which swing points they connect and whether they use wicks or bodies. Horizontal levels and market structure are both more objective.
Can I redraw a trendline if price breaks it?
Not after entering a trade on it. Redrawing to produce a line that has not broken is rationalising a losing position rather than refining analysis. If you find yourself doing this, the trendline was not genuinely the basis for the trade.
What is a channel in trading?
Two parallel lines forming a corridor that price moves within — the trendline plus a parallel line on the opposite side. Useful for judging whether price is relatively high or low within a trend, and for setting targets at the opposite line.