
Multiple Timeframe Analysis in Forex — Top-Down Method
October 30, 2026

A chart showing a clear uptrend and a chart showing a clear downtrend can be the same instrument at the same moment. Understanding why resolves most of the confusion beginners experience, and it is the single change that improves chart reading fastest.
The problem it solves
A trader looks at the 15-minute chart, sees a clean downtrend, and sells. Price moves against them immediately and keeps going.
What they missed: the daily chart was in a strong uptrend, and that 15-minute downtrend was the pullback within it. They sold into support, against the dominant flow, at exactly the point where buyers were waiting.
This is not a rare error. It is the single most common structural mistake in retail trading, and multiple timeframe analysis is the direct fix.
How timeframes relate
Each timeframe is a zoom level on the same price data. Higher timeframes compress more information into each candle, so they show larger structure while hiding detail.
One daily candle = 6 four-hour candles
One 4H candle = 16 fifteen-minute candles
One 15M candle = 3 five-minute candles
A movement that fills an entire 15-minute chart might be one wick on the daily. Both are accurate; they describe different scales.
Higher timeframes carry more weight because more participation formed them. A daily support level represents a full day of buyers. A 15-minute level represents fifteen minutes, potentially involving very little volume.
The three-timeframe structure
The standard approach uses three charts with defined roles.
| Role | Purpose |
|---|---|
| Higher | Direction — which way you may trade |
| Trading | Setup — where the entry forms |
| Lower | Timing — refining entry and stop |
Common combinations, with roughly a 4x to 6x step between each:
| Style | Higher | Trading | Lower |
|---|---|---|---|
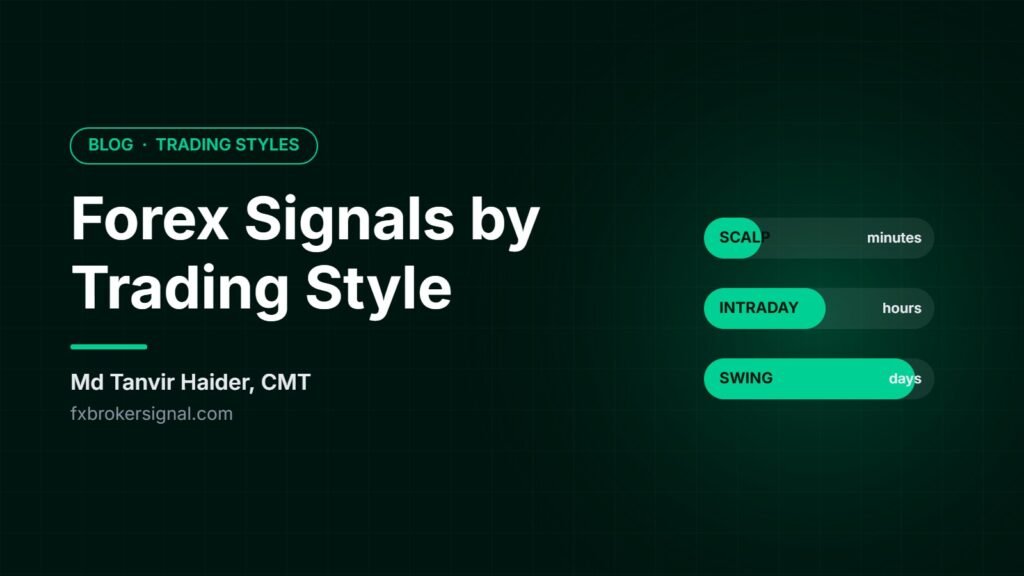
| Scalping | H1 | M15 | M5 |
| Intraday | H4 | H1 | M15 |
| Swing | D1 | H4 | H1 |
| Position | W1 | D1 | H4 |
Steps smaller than 4x produce charts too similar to add information. Steps larger than 6x create a gap where the structure on one chart does not connect visibly to the other.
The workflow
Always top down. This order matters.
Step one — higher timeframe. Determine trend direction from structure. Mark the major levels. This establishes which direction you are permitted to trade and nothing else.
Step two — trading timeframe. Look for a setup in that direction only. A pullback to a level, a consolidation, a pattern forming. Counter-trend setups are ignored regardless of how good they look.
Step three — lower timeframe. Refine the entry. A tighter reversal signal here allows a closer stop, which means a larger position for the same risk.
SWING EXAMPLE
Daily: Higher highs and higher lows.
Support zone at 1.0850.
→ Longs only.
4-hour: Price pulling back toward 1.0850.
→ Setup forming.
1-hour: Bullish engulfing at 1.0855.
→ Entry. Stop below 1.0830.
Notice how the three charts do different jobs. The daily said what direction. The 4-hour said where. The 1-hour said when.
Why the lower timeframe helps position size
A practical benefit that is frequently overlooked.
Entering directly on the 4-hour chart means a stop placed at the 4-hour structure — perhaps 60 pips away. Entering on a 1-hour confirmation within the same zone might allow a 35 pip stop.
Same trade idea, same risk in money terms, but the tighter stop permits a larger position. If the trade works, the outcome is meaningfully better.
The Lot Size calculator makes this concrete — enter both stop distances and the difference in permitted position size is immediate.
Reading conflicts
Timeframes disagreeing is normal, not a problem to resolve.
Daily: Uptrend
4-hour: Downtrend
Reading: The 4H downtrend IS the daily
pullback. You are waiting for it
to end, not trading it.
The signal you want is the lower timeframe downtrend breaking — a higher high on the 4-hour, indicating the pullback has finished and the daily uptrend is resuming.
Trading the lower-timeframe move directly means fighting the higher timeframe. Waiting for it to end means entering with the higher timeframe at a good price.
The reframe that helps most
A counter-trend move on your trading timeframe is not a trade opportunity. It is the setup forming. Once you read it that way, the frustration of watching price move against your bias disappears — that movement is what creates the entry you are waiting for.
Common mistakes
Working bottom up. Finding a setup on a low timeframe, then checking whether the higher timeframe agrees. This reverses the logic and produces confirmation bias — you will find a way to read the higher chart as supportive.
Too many timeframes. Four or five charts produce contradictions that paralyse decisions. Three is sufficient.
Timeframes too close. H1 with M30 shows essentially the same information twice.
Switching after entry. Entering on the 4-hour then managing the trade on the 5-minute reintroduces exactly the noise the higher timeframe was filtering. The trade was taken on a 4-hour basis and should be managed on that basis.
Forcing alignment. Sometimes the timeframes genuinely conflict without a clean reading. Not trading is a valid outcome.
Applying this to what you have learned
Multiple timeframe analysis is the framework that organises the rest of this section.
Structure from Lesson 5 is read on the higher timeframe. Levels from Lesson 4 are marked on the higher timeframe and traded on the lower. Candlestick patterns from Lesson 3 are the lower-timeframe trigger. Chart patterns from Lesson 7 form on the trading timeframe.
Each tool has a natural timeframe, and using them at the wrong one is a common source of poor results. A daily support level with a 5-minute pin bar trigger is a coherent combination. A 5-minute support level with a daily pin bar is not.
A practical exercise
Pick one instrument. Open three charts: daily, 4-hour, 1-hour.
Write down, in this order: daily trend direction, daily key levels, whether the 4-hour is aligned or pulling back, and what would need to happen on the 1-hour to signal an entry.
Ten minutes per instrument. Doing this daily for two weeks builds the top-down habit more effectively than any further reading, because the sequence becomes automatic rather than deliberate.
What to do next
The next lesson covers volume in forex — what tick volume actually measures, its genuine limitations, and how much weight it deserves.
Frequently asked questions
What is multiple timeframe analysis?
Reading the same instrument across three charts with defined roles — higher for direction, trading timeframe for the setup, lower for entry timing. It prevents trading against the dominant flow, which is the most common structural error in retail trading.
Which timeframes should I use together?
Roughly a 4x to 6x step between each. Swing traders commonly use daily, 4-hour and 1-hour. Intraday traders use 4-hour, 1-hour and 15-minute. Smaller steps show the same information twice; larger steps break the visible connection.
Why do my timeframes show different trends?
Because a counter-trend move on a lower timeframe is how a higher-timeframe pullback looks when you zoom in. Both readings are correct. The lower-timeframe move is the setup forming, not a trade to take.
Should I start with the higher or lower timeframe?
Always higher first. Finding a setup on a low timeframe and then checking the higher chart produces confirmation bias — you will read the higher chart as supportive because you already want the trade.
How many timeframes should I use?
Three. Four or five produce contradictions at any given moment, which paralyses decisions or invites cherry-picking whichever chart supports your existing view.
Can I manage a trade on a lower timeframe than I entered?
Better not to. Entering on the 4-hour and then watching the 5-minute reintroduces exactly the noise the higher timeframe was filtering out, which typically leads to closing good positions early.