
What Is ATR? Average True Range for Stops and Sizing
October 31, 2026
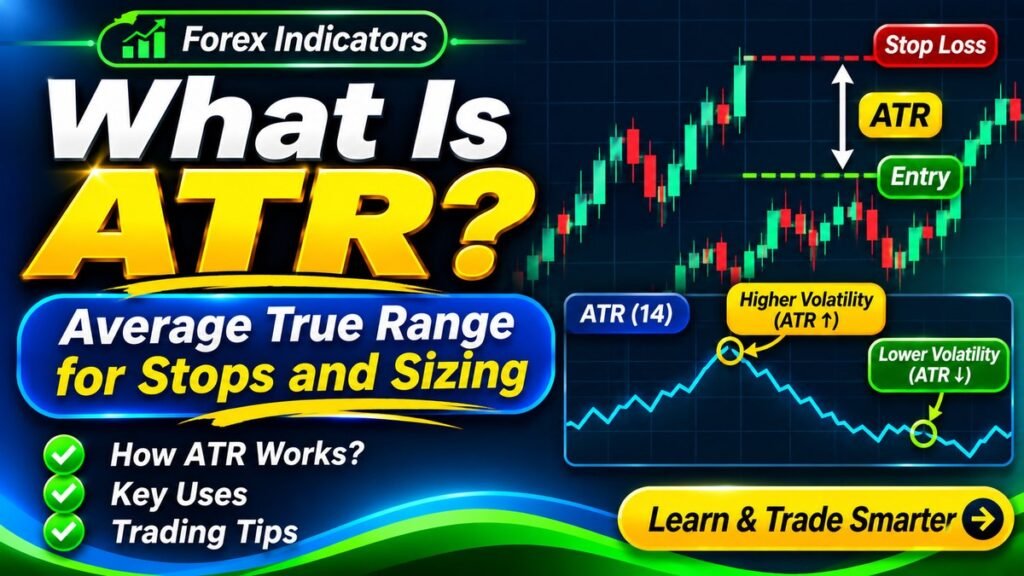
ATR generates no buy or sell signals, which is why most beginners skip it. It is also, in my view, the most practically valuable indicator a new trader can learn — because it answers the question that actually determines survival: how far should my stop be, and how large should this position be?
What ATR measures
ATR stands for Average True Range. It measures how far an instrument typically moves over a given period, expressed in the instrument’s own price units.
“True range” accounts for gaps, taking the largest of three measurements for each candle:
True range = the largest of:
current high − current low
current high − previous close
previous close − current low
ATR = average of true range over 14 periods
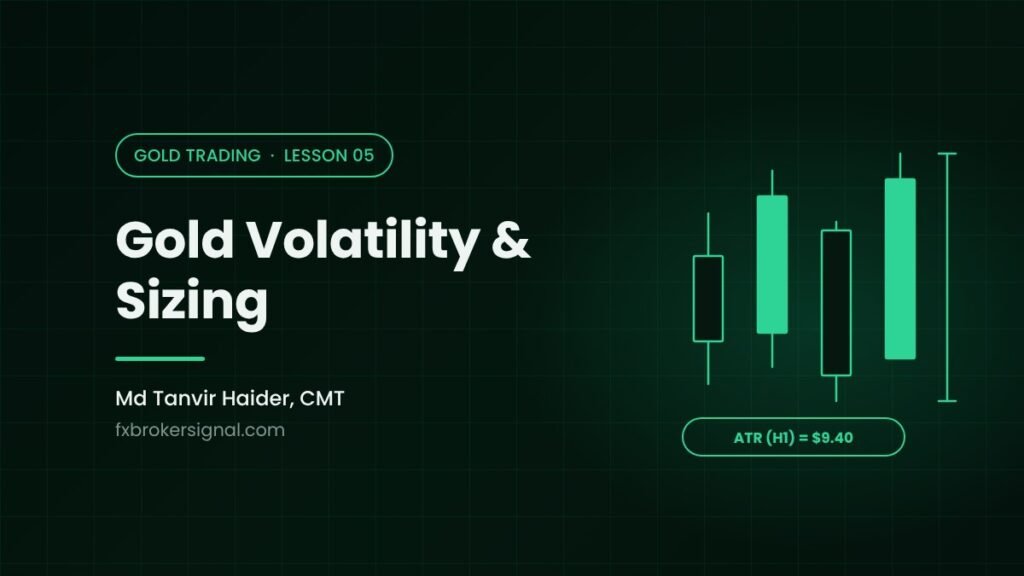
The result is a single number telling you the typical movement per candle. On EUR/USD daily, ATR might read 0.0070 — 70 pips. On gold, it might read 25.00 — $25 per ounce.
ATR has no direction. It rises when movement increases regardless of whether price is going up or down. A market crashing produces high ATR exactly as a market rallying does.
Why this matters more than signals
Consider a trader who uses a fixed 30 pip stop on every trade.
On EUR/USD during a quiet session, where daily ATR is 60 pips, a 30 pip stop sits at half the typical daily movement. That is reasonably placed — ordinary noise will not usually reach it.
On gold, where daily movement can be ten times larger in equivalent terms, that same 30 pip stop sits well inside normal noise. It will be hit constantly, on trades whose analysis was perfectly sound.
The trader concludes their strategy does not work on gold. The strategy was never tested — the stop was simply too tight for the instrument’s volatility.
Why this matters so much
A large share of losses I see among newer traders come from stops placed at distances unrelated to how the instrument actually moves. The analysis was fine, the direction was eventually right, and the position was closed by ordinary noise before the move developed. ATR fixes this, and it takes about a minute to learn.
Using ATR for stop placement
The standard approach is a multiple of ATR.
EUR/USD 4H chart
ATR(14) = 0.0025 (25 pips)
Stop at 1.5 × ATR = 37 pips
Stop at 2.0 × ATR = 50 pips
A multiplier between 1.5 and 2.5 is common. Tighter than 1.5 tends to sit inside normal fluctuation. Wider than 3 usually means the position becomes too small to be worth taking.
The crucial point: a wider stop does not mean more risk. It means a smaller position. Risk in money terms stays identical because position size adjusts.
Account $2,000, risking 1% = $20
Quiet market: ATR 20 pips → stop 30 pips
$20 ÷ 30 = 0.066/pip → 0.06 lots
Volatile market: ATR 50 pips → stop 75 pips
$20 ÷ 75 = 0.027/pip → 0.03 lots
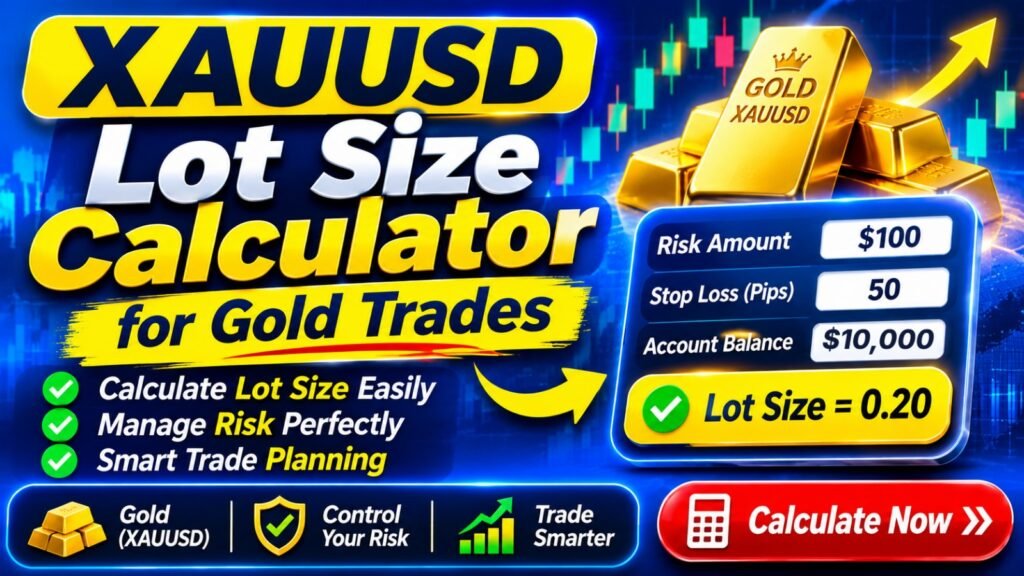
Same risk, different position sizes, appropriate stops in both conditions. This is what adapting to volatility actually looks like in practice, and the Lot Size calculator does the conversion in seconds.
Using ATR for targets
The same logic applies to profit targets. A 100 pip target is ambitious on an instrument with 40 pip daily ATR and modest on one with 300.
Setting targets as ATR multiples keeps expectations proportionate to what the instrument actually does. If your stop is 1.5 ATR and your target is 3 ATR, you have a 1:2 risk-reward ratio expressed in terms the market can actually deliver.
This also provides a sanity check. If a setup requires price to move four times its normal daily range to reach your target within the day, the setup is not realistic regardless of how good the chart looks.
Using ATR to read market conditions
ATR also describes the environment you are trading in.
Rising ATR — volatility expanding. Moves are larger, trends may run further, but stops need more room and false moves are more violent.
Falling ATR — volatility contracting. Ranges are tightening, breakout strategies will struggle, and range strategies become more viable.
Very low ATR — the market has gone quiet. As with the Bollinger squeeze from the previous lesson, this often precedes an expansion.
Comparing current ATR to its own recent readings is more informative than the absolute number. ATR at 30 pips means little in isolation; ATR at 30 pips when it averaged 60 last month tells you conditions have changed materially.
ATR across instruments
ATR is expressed in the instrument’s own units, which makes direct comparison awkward. A useful approach is converting to a percentage of price.
| Instrument | Typical daily ATR | As % of price |
|---|---|---|
| EUR/USD | 60–90 pips | ~0.6–0.8% |
| GBP/JPY | 120–180 pips | ~0.8–1.2% |
| XAU/USD | $20–40 | ~1.0–1.8% |
Indicative ranges only — check current readings on your own platform.
This comparison explains something many beginners discover expensively: gold typically moves two to three times as much as a major currency pair in percentage terms. Trading it at the same position size you use on EUR/USD means taking two to three times the risk without intending to.
Settings
The default is 14 periods. Shorter settings react faster to volatility changes but are noisier. Longer settings smooth more.
Unlike signal indicators, ATR settings are relatively uncontroversial, because you are measuring a property of the market rather than trying to time entries. The default is fine for nearly all purposes.
One practical note: ATR readings differ by timeframe. Daily ATR is far larger than 15-minute ATR on the same instrument. Always read ATR on the timeframe you are actually trading.
Where ATR falls short
It is backward-looking. ATR describes recent volatility. A major news release can multiply actual volatility instantly while ATR still reflects the prior quiet period.
It lags after spikes. A single violent candle remains in the 14-period window for 14 candles, keeping ATR elevated after conditions have calmed.
It gives no direction. This is by design, but worth stating — ATR cannot help you decide whether to buy or sell.
Why this lesson matters more than it appears
Most indicator content focuses on entry signals, because that is what traders search for. Entry accuracy is the part of trading that feels most important and matters least.
Stop placement and position sizing determine whether you survive long enough for your entry edge — whatever it is — to produce results. ATR is the tool that connects those two things to how the market is actually behaving, rather than to a fixed number you chose arbitrarily.
A trader with mediocre entries, correct ATR-based stops and disciplined sizing will outlast a trader with excellent entries and fixed 20 pip stops applied to everything. I have watched both, repeatedly, and the outcome is consistent.
What to do next
You now have trend, momentum and volatility covered. The next lesson covers Stochastic — another momentum oscillator, useful specifically in ranging conditions where RSI and MACD struggle.
Frequently asked questions
What does ATR tell you?
How far an instrument typically moves over a given period, in its own price units. It measures volatility without direction — ATR rises when movement increases whether price is going up or down.
How do I use ATR for stop loss placement?
Multiply ATR by 1.5 to 2.5 and place your stop that distance from entry. This keeps the stop outside normal market noise while adapting automatically to current conditions. Position size then adjusts to keep money risk constant.
Does a wider stop mean more risk?
No, provided you adjust position size. A 75 pip stop with a small position carries identical money risk to a 30 pip stop with a larger one. Risk is determined by stop distance multiplied by position size, not by stop distance alone.
What is a good ATR multiplier?
Between 1.5 and 2.5 for most approaches. Below 1.5 tends to place stops inside normal fluctuation. Above 3 usually makes the position too small to justify. The right value depends on your timeframe and how much room your strategy needs.
Can ATR predict market direction?
No. ATR has no directional component by design. High ATR means large movement, which could be strongly up or strongly down. It answers “how much” rather than “which way.”
Why is my ATR different on different timeframes?
Because it measures movement per candle, and a daily candle covers far more movement than a 15-minute one. Always read ATR on the timeframe you are actually trading, and recalculate if you change timeframes.